Data Science Final Project
Introduction
There are many UFO reports across the United States categorized by event date, state, shape of UFO and date posted.Our project tends to analyze correlation between UFO reports and other data, like GIS and weather. Our project tends to analyze correlation between UFO reports and other data, like GIS and weather.
Questions of interest
- How can we predict when and where UFO will appear, and the trend of its occurrence?
- With so many UFO reports, how can we figure out which of these UFO reports are fake?
- Are there any relationships between UFOs features or characteristics with corresponding weather or GIS information?
Data structure
Data source: The National UFO Reporting Center Online Database
Data structure:
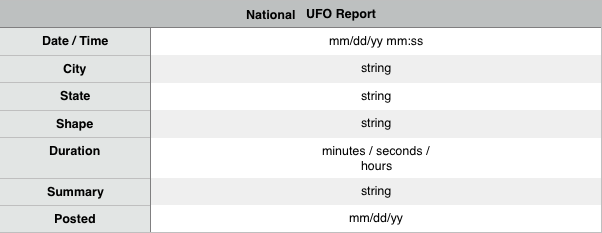
UFO report data before cleaning:
b'\\r\\n2/22/17 19:30 \\r\\nSwanville \\r\\nME \\r\\nLight \\r\\n45 minutes \\r\\nBright pulsating white light brighter than Venus in vicinity of Swanville, ME. ((anonymous report)) ((NUFORC Note: Venus. PD)) \\r\\n2/22/17 \\r\\n\\r\\n '
UFO report data after cleaning:
        b'time'   b'city'   b'state'  b'shape'  b'duration' b'summary'

        b'2/22/17 19:30'  b'Swanville'  b'ME'   b'Light'  b'45 minutes' b'Bright pulsating white light brighter than Venus in vicinity of Swanville, ME.  ((anonymous report)) ((NUFORC Note:  Venus.  PD))'
Method & Technology
Predicting about UFO needs correlation of many sources of data, including the UFO-report data, geography information, and the weather. UFO Reports is the basic data of our system. There are 5 steps regarding our data:
- Creating database of GIS, UFO-Reports and weather.
- Using NLP technology to analyze summary data in the UFO Reports data. To extract features about UFO. Creating chart (style, color, characteristics) of UFO.
- Indexed by date and location data of UFO Reports, scraping the corresponding GIS and weather data, and integrating them together.
- Using machine-learning or neural network to train our data, figure out patterns and correlation between UFO witness with GIS and weather at that time.
- Combining the information entered by user and weather forecasting data to do prediction In order to predict the possibility to see an UFO in the future.
We will use SQLite to store our data. We will create a system based in python that does Natural Language Processing, Classification and generating statistical results. With UFO-witness summaries, we are able to extract high probability features of UFO occurrence, such as shape, color, movement, brightness. We would then use these data to generate charts of all documented UFO characteristics. With time, location and weather data we could used to predict future events of UFO. By user inputting desired destination, time and weather condition, our system will generate a probability one would encounter UFO appearance. We will also build an interactive front-end for users to change parameters and see results.
Visualization
We will incorporate HTML5 + CSS3 with Python Server to create a modern interactive web application. Users will be able to access using a computer or smartphone. By selecting parameters such as weather, location, and time, users will see the likelihood of an UFO occurrence. Users could also see visualizations of statistical data by selecting criteria such as time of the day, day of the month, month of the year, places, shapes, weather conditions etc. Finally we will provide a text-area where users could enter UFO reports, and our application will give probability of whether such report is a hoax or not based on analyzing the existing language contents of UFO events.
We will use D3, CG to create charts that show the features we extract from the witness summary data. D3 creates visualization of Big Data analysis results. Map to show the distribution of UFO witnesses, as well as visualizes their relation with weather and GIS. All of the above can be shown on a website.
What to Do
We are now working on Google Map API, to make map visualization of our witness report data. We are also on our way to create database.