Data Science Final Project
Data Characters and Preprocessing
At first glance, our data are very difficult to handle. There are two kinds of data for each UFO events: description summary, which is a text information, and numeric features, which are easy to digitalize. This means it is not possible to analyze all of them at the same time. Another thing is that our data has no label, which means supervised learning will not be applicable.
By investigating NUFORC(The National UFO Reporting Center)'s comment for each event, we found that they make notes on reporters' description summary of some flawed, or even hoaxed, reports. For example, someone reported sighting of white flashing orb-like object and NUFORC comments that it was possible sighting of Venus instead of sighting of UFO. In our 90000+ records of data, there are 4000+ reports that are believed by NUFORC to be flawed reports, thus we add a label '0'(fake) to these reports, and add a label '1'(genuine) to the remaining 80000+ reports.
However, this rises another issue of our dataset --- the proportions of data with '0' and '1' are very unbalanced, with only a small percentage of data(about 4.5%) being labeled '0'. We need to be very careful for this unbalanced dataset, because a high accuracy (up to 95%) maybe easily get by simply assigning '1' to all samples.
Machine Learning for Fake Detection
Our first goal is to build machine learning algorithms for fake report detection. Based on this goal, we developed a new score to judge one model:
judge_score = (cross_valid_score * 0.8 + TP / (TP + FN) * 0.2) / 2
Cross_valid_core reflect the whole accuracy of model, while TP / (TP + FN) reflects how many fake reports are detected. By alternating class weight, SVM with RBF Kernel, Logistic Regression and Linear SVM models can solve unbalanced dataset problems better and we use this judge_score to find out best class weight for each model. Finally, we build two kinds of model, for numeric features (lat, lng, time, shape, weather and visibility) and description summary separately:
Note:
- We discard Logistic Regression model for numeric features, and SVM with RBF Kernel for description features. This is because they are too sensitive to class weight, i.e., assign all samples to '1' for weight n while assign all samples to '0' if weight n increases slightly. Another reason is that SVM with RBF Kernel consumes too long to train for description features.
- We do preprocessing.scale for features when training SVM - RBF kernel, because it has higher accuracy and shorter training time. To maintain consistency, we also do this step for one-class SVM model.
- Since one-class SVM is some kind of novelty detection algorithm, cross validation score makes no sense for it. The judge_score is just calculated by TP / (TP + FN). The meaning of this model is to detect reports that is most likey fake.
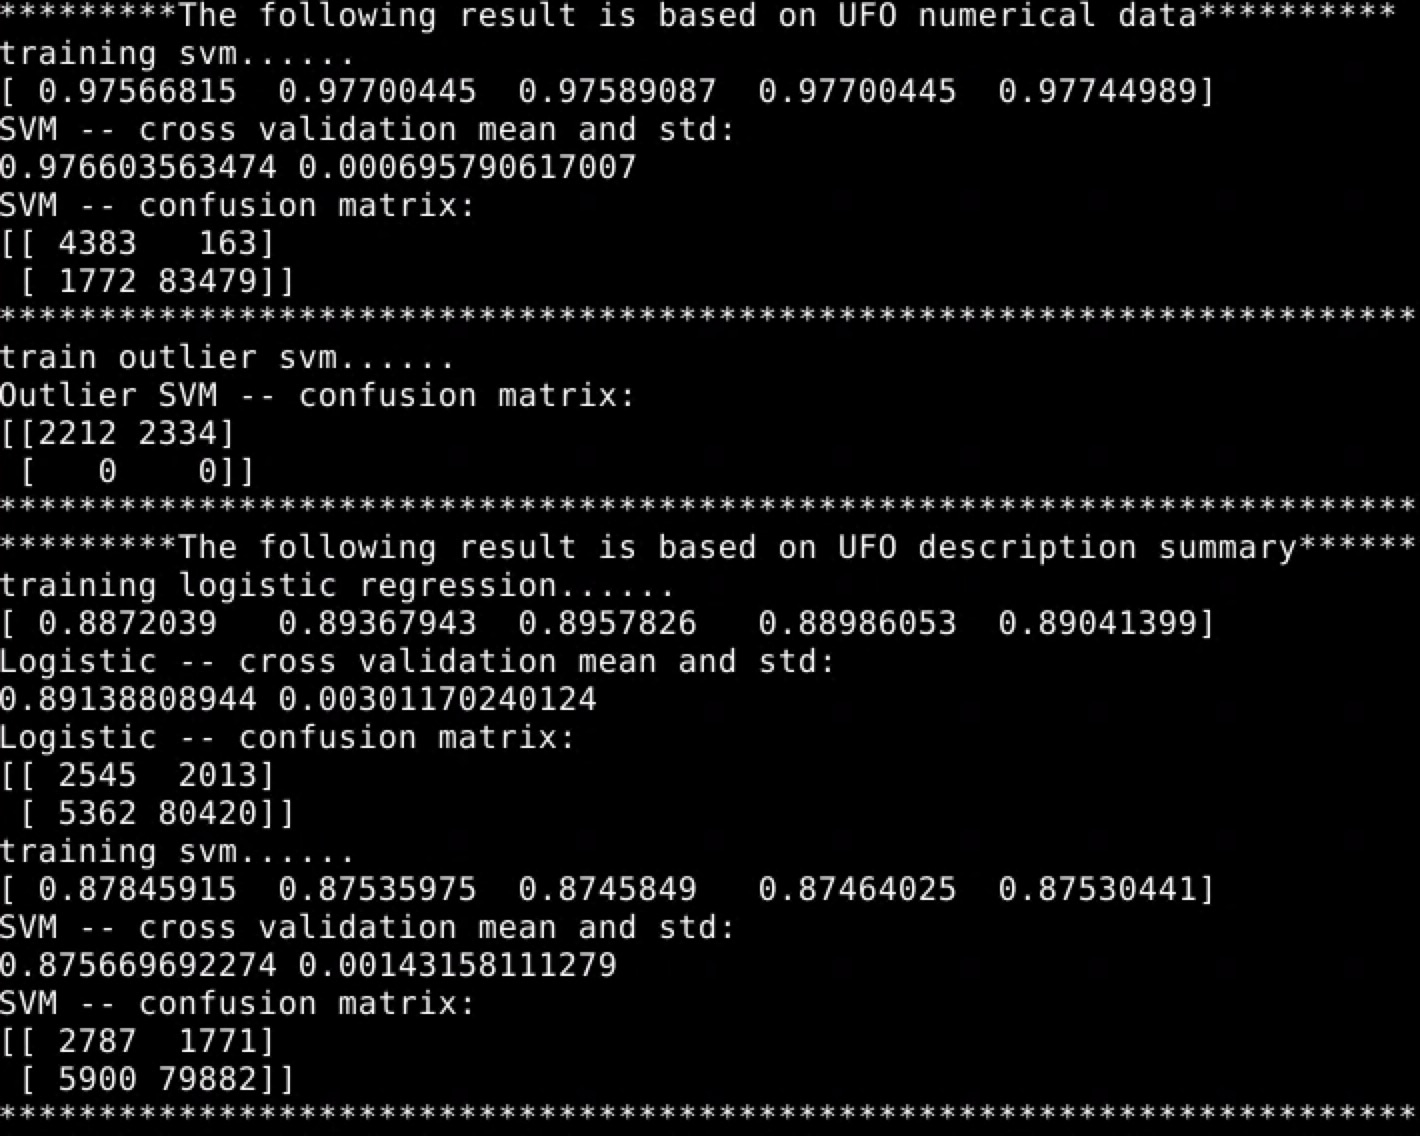
Below is the cross validation values and confusion matrixes of different classifiers: