Data Science Final Project
Model and Database Refreshing
We added a new kind of model: Decision Tree to our fake detection model poll. This model performs well on both numeric and text features, with judge_score both equal to 0.921.
Previously, we left some work of cleaning in model training and data file generalizing program. After carefully thinking, combining with data format requirements of all parts of our data-pipeline, I decided to push all cleaning work before loading data into database, even applying Porter Stemming Algorithm on summary data. The new format of event table in our database is:
    events(event_id:int, year:text, month:text, day:text, time:text, city:text, state:text, shape:text, duration:text,
    summary:text, lat:float, lng:float, label:int)
Note: Durations are now all in seconds, if one sighting report doesn't provide this information, I set it to -1; summary column is now in a really clean format: with no NUFORC comments, punctuation mark, and all words processed by Porter Stemming Algorithm. One row of SQL may look like:
10|2016|12|31|23:50:00|Anchorage|AK|fireball|1200|three bright orang orb exhibit odd flight pattern abov ted steven airport|61.2180556|-149.9002778|1
Web Application nearly Done
Recently, we spent most of our time on web application. We try to make it like a real web, not just a demo. Based on our framework structure on blog III, we enriched website functions a lot. We are building 4 subpages: Report, Statistic, Database, About.

Refreshed the report page:
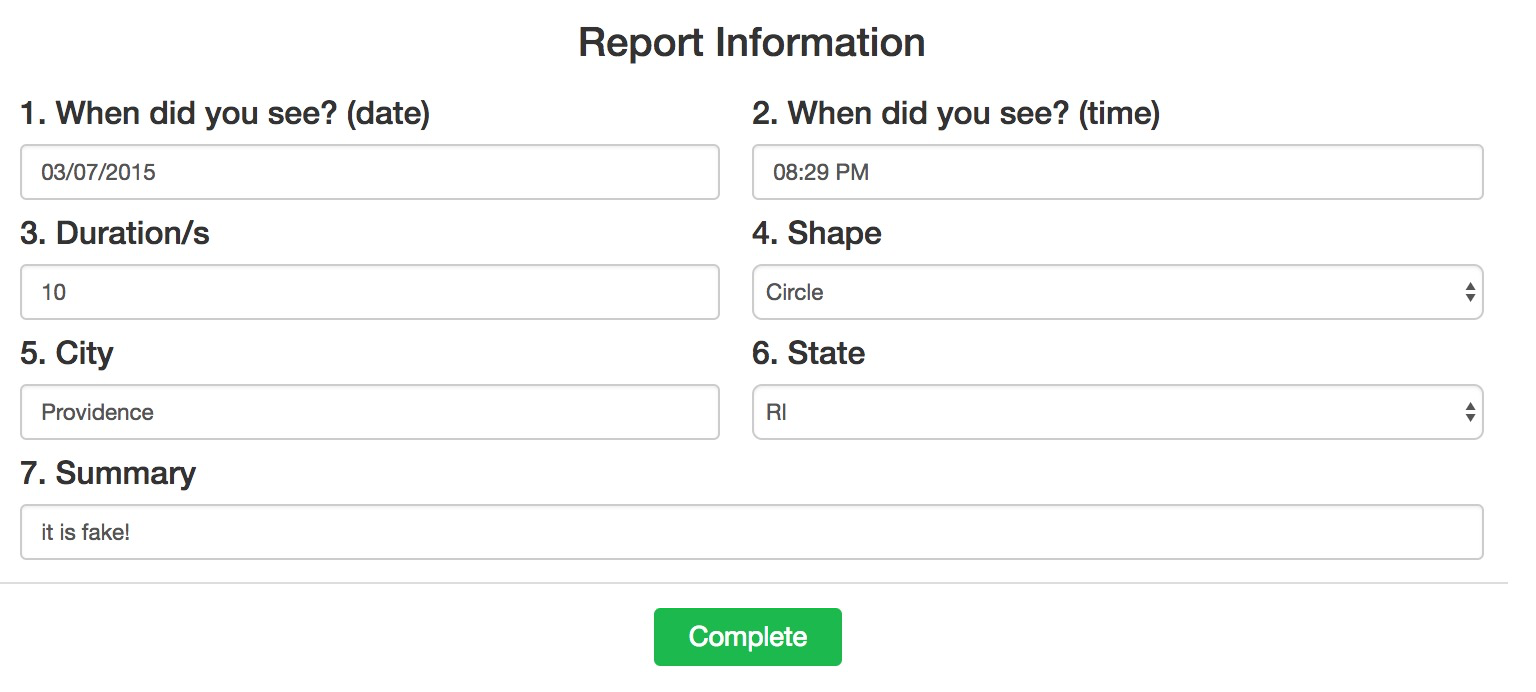
This time, after users submit their sighting information, I not only give back the probability of truthfulness, but many charts to help analyze their reports as well:
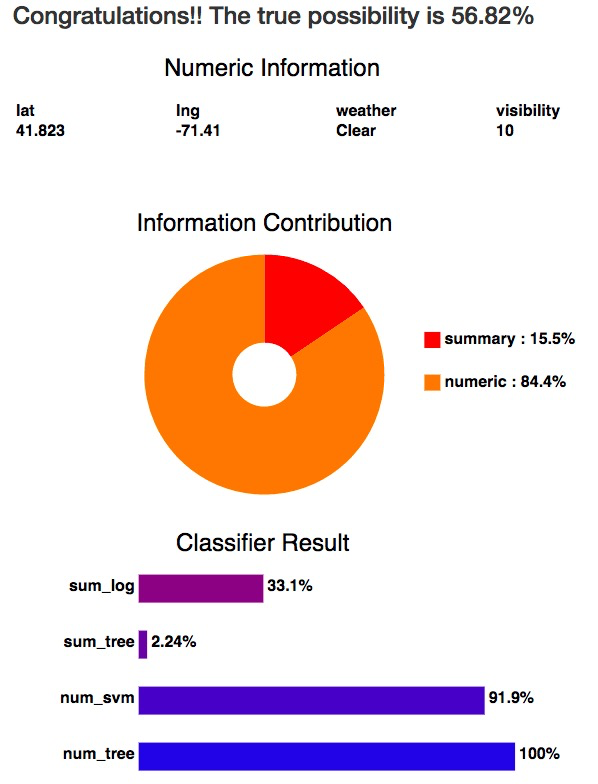
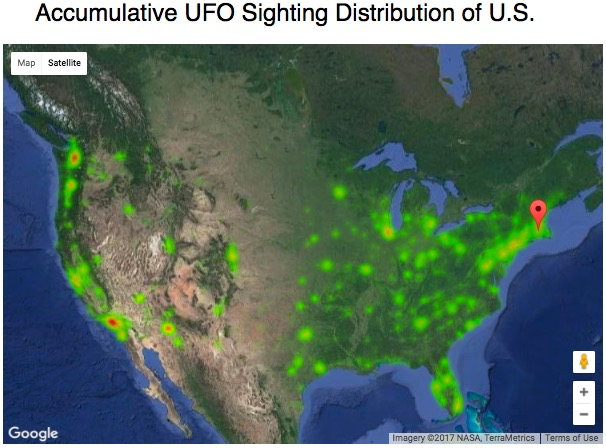
First, it gives back the truthfulness possibility of sighting report. Then, it shows the additional numeric information, like lat, lng, weather and visibility. The pie chart shows the contribution percentage of numeric and summary information to the above possibility. The classifier result histogram presents the truth possibility of each classifier. Finally, GoogleMap shows the accumulative UFO sighting distribution of U.S., as well as the location of submitted report. It intends to show the relative GIS information according to historical records.
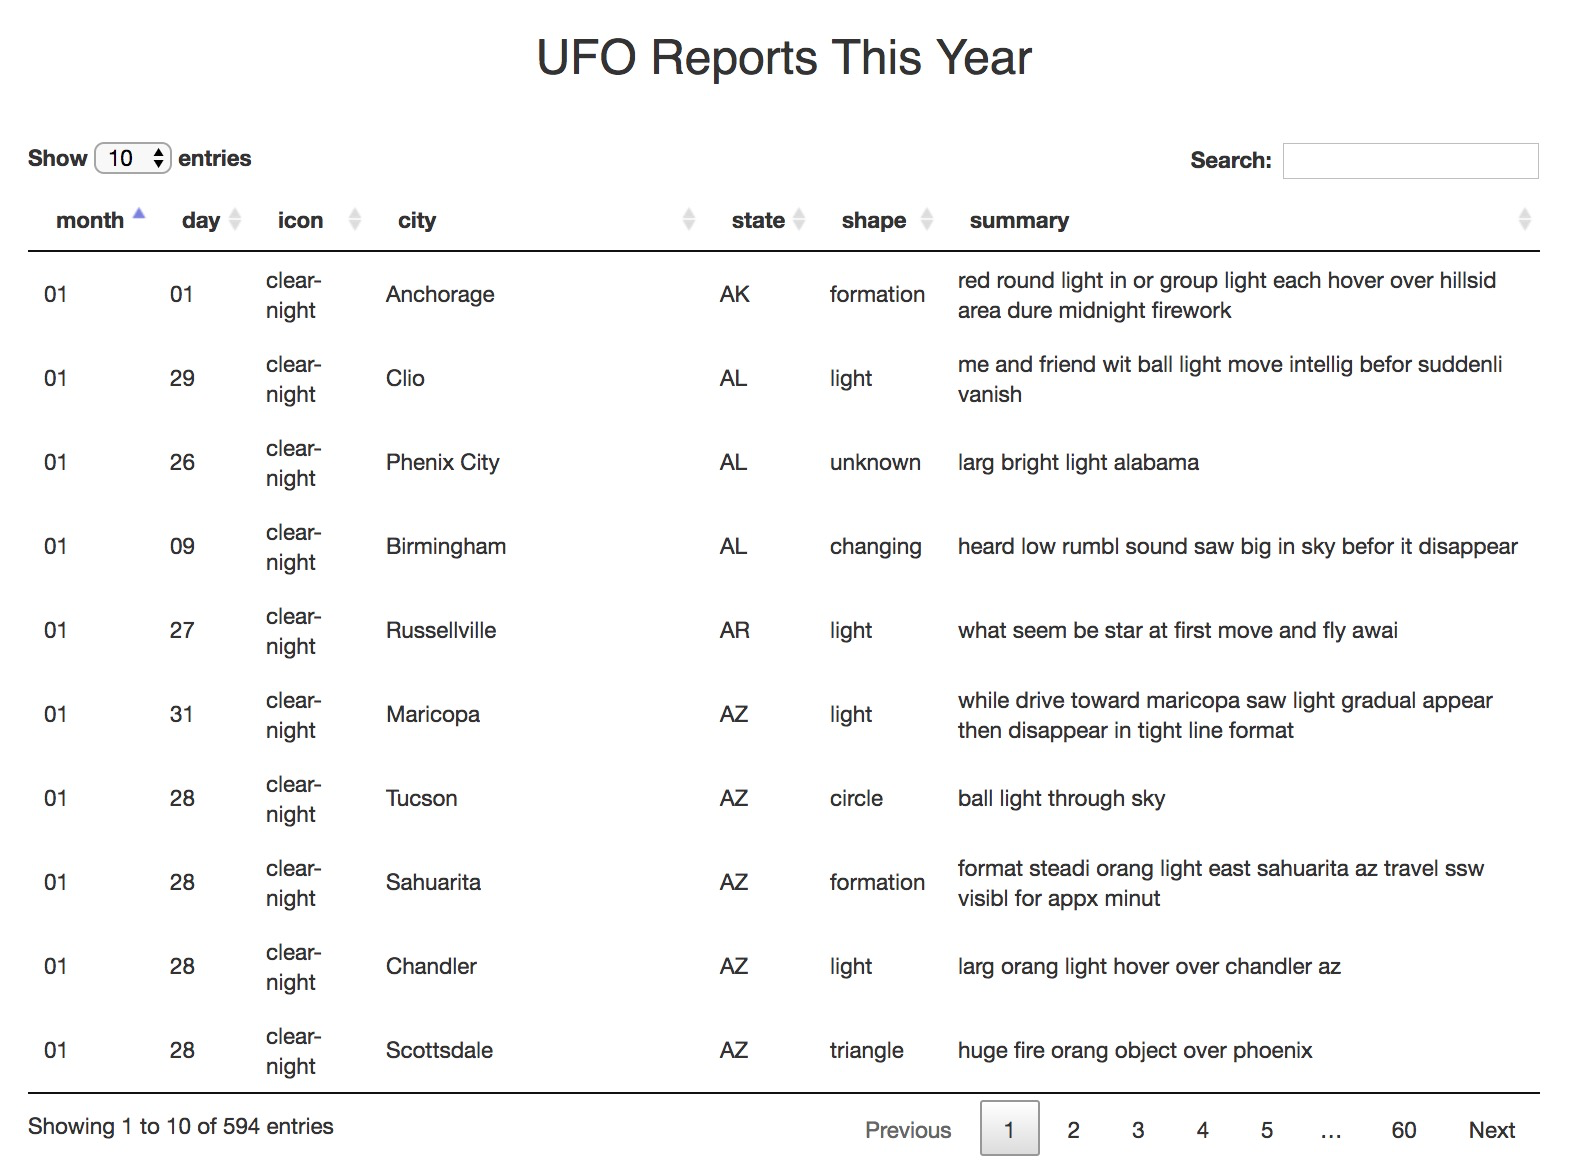
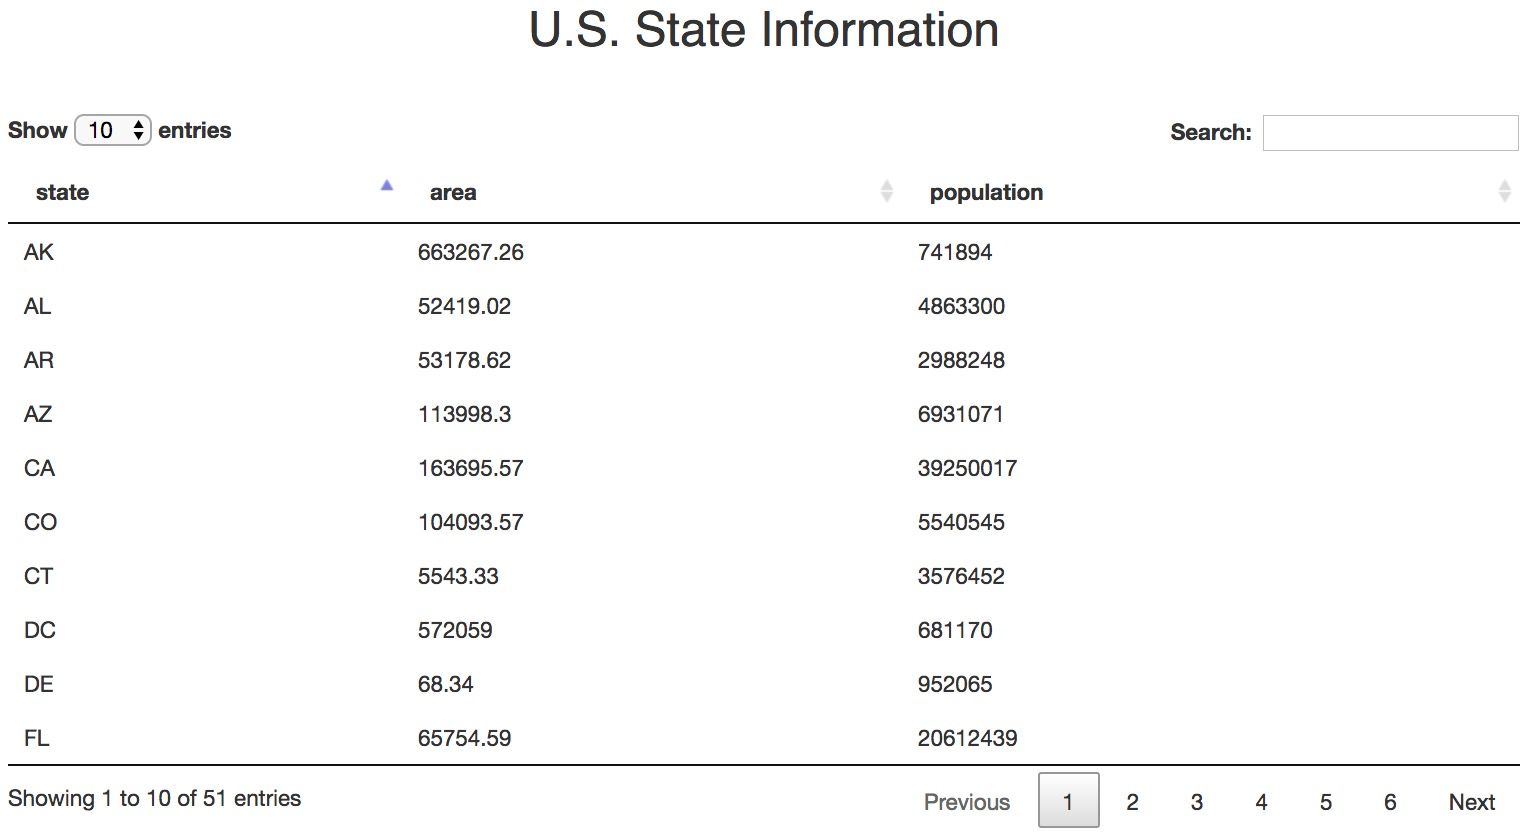
The database web page uses dataTables.js. It shows UFO reports of 2017, as well as U.S. state information we used:
We also use dc.js to create linked D3 graphics which shows the correlation between UFO sighting, GIS, and weather:
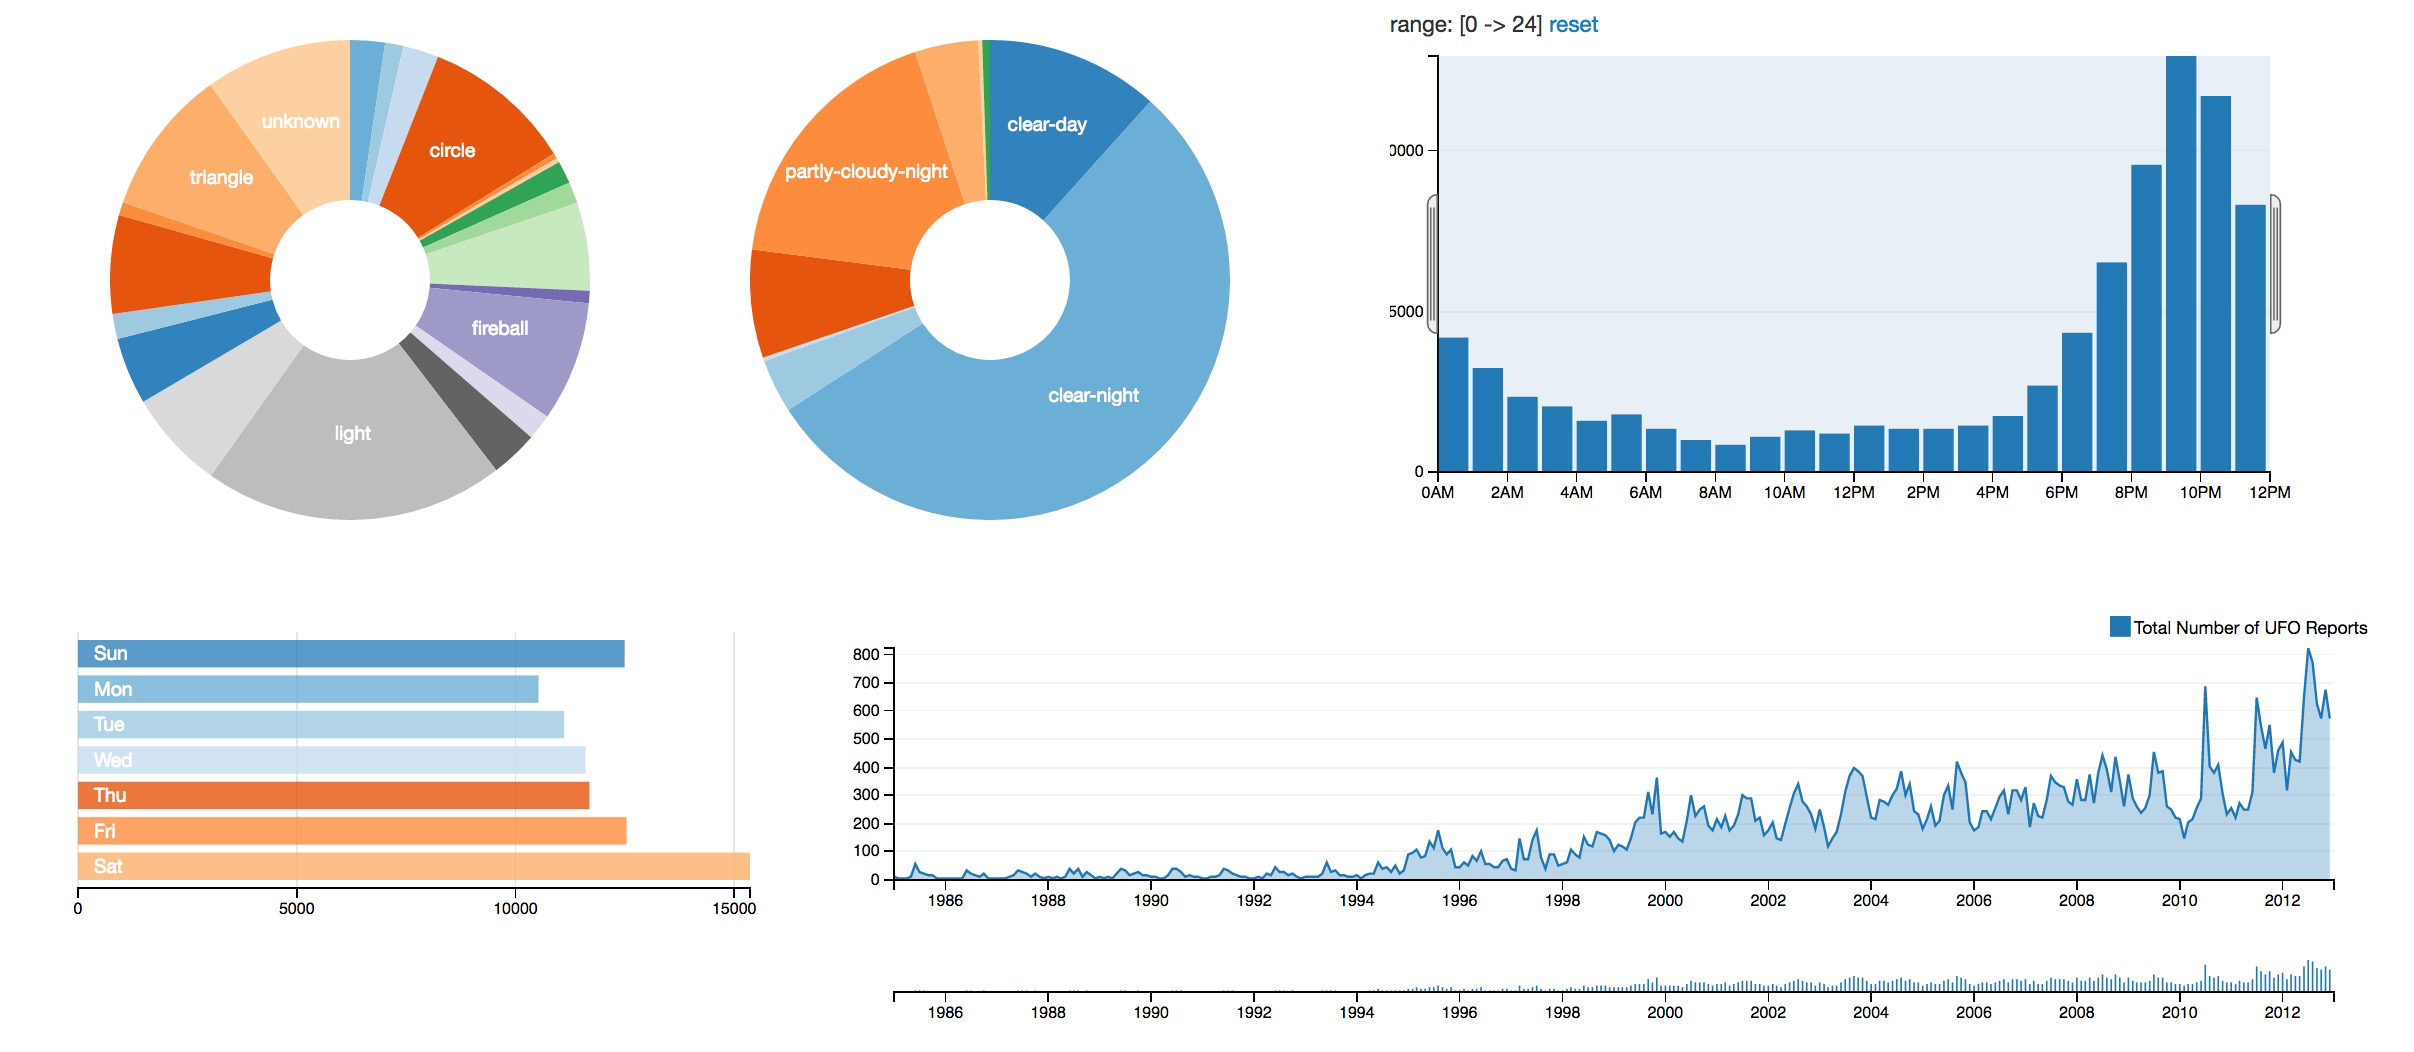
It contains shape, weather distribution of sightings, how UFO sightings spread around 24 hours, as well as weekdays, and different years.
Some Statistic Analysis
From statistic figure above, we can see that almost half of UFO sightings are at clear-night, around 9-12 PM. Saturday and Sunday have slightly higher reports than the weekdays. The total number of reports trends to increase as a whole, while decreases a little bit recently.