Data Science Final Project
Project Summary
In this project, we try to investigate this topic in three steps. First, we figure out correlations between UFO sightings and data from other sources, such as geometry, weather, population and territory area. Second, based on statistic analysis and machine learning techniques, we develop models to detect fake UFO reports. Finally, we build up a web application to visualize our analysis results and to provide users a way to interact with our project, such as enabling them to report their own sightings and get access to fake detection result.
The whole data pipeline of our system is as follows:

We build a database containing 4 tables, the data schema is:

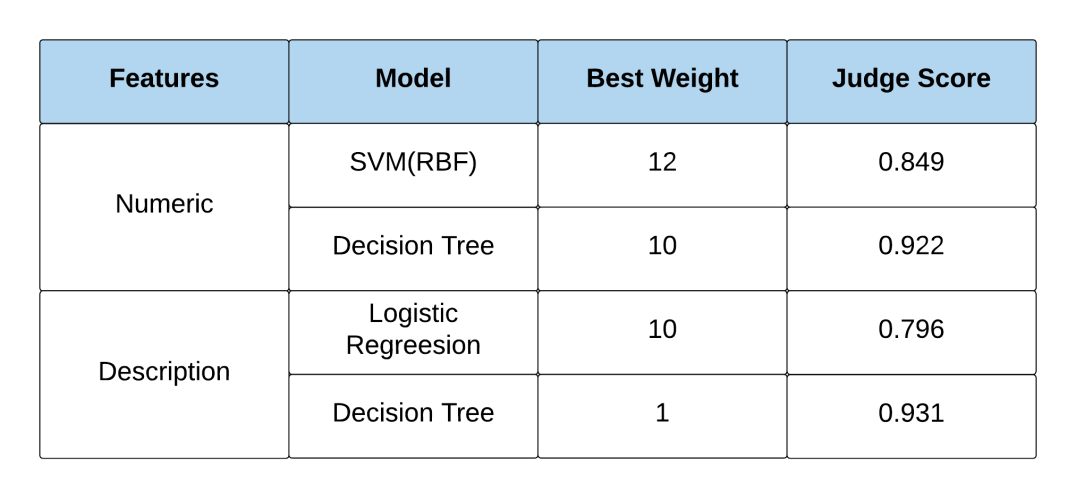
We use machine learning methods to detect fake reports. The model we used are Decision Tree, Logistic Regression, SVM-RBF. Our data has both numeric and text features. The results of our models is

Conclusions
- Many UFO sightings occur at night, between 9 PM and 12 PM during a day, no matter whether it is clear or partly-cloudy.
- Sighting distribution across U.S. are imbalanced. States that near lakes, deserts and oceans tend to report more UFO sightings. California reports the most sightings, which also gets highest estimated marginal means of sighting duration.
- Whether an UFO sighting report is true or just a hoax has close relationship to numeric features we extract. By using location information, time of a day, UFO shapes, weather conditions, our models can detect fake reports with a relatively high accuracy.
- For text features, the word ”reptile” has the biggest positive score, while the word ”meteor” has the biggest negative score.
- Total UFO sighting number increases as year goes by, although slightly decreased recently. By using population and year as independent variable, our regression model predicts that there maybe 5589 UFO sightings in 2017.