Data Science Final Project
Data Analysis
We collect UFO reports data from website http://www.nuforc.org/, GIS data from Google's API https://maps.googleapis.com/maps/api/geocode/ and weather data from https://darksky.net/.
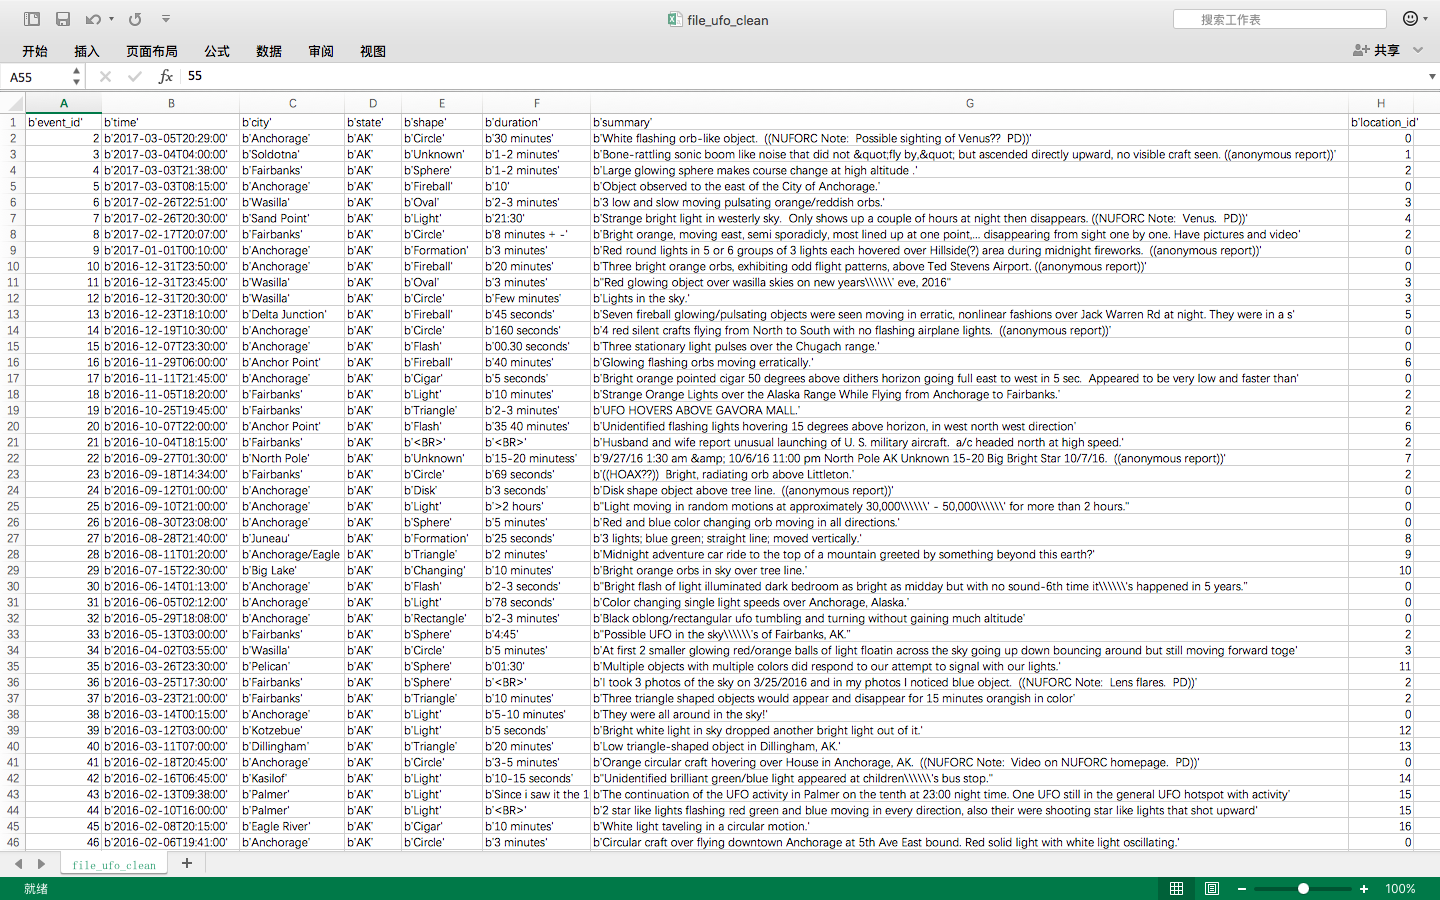
After data cleaning, UFO reports data has eight columns: event_id, time, city, state, shape, duration, summary and location_id. Here's a glimpse of our UFO reports data stored as CSV file:
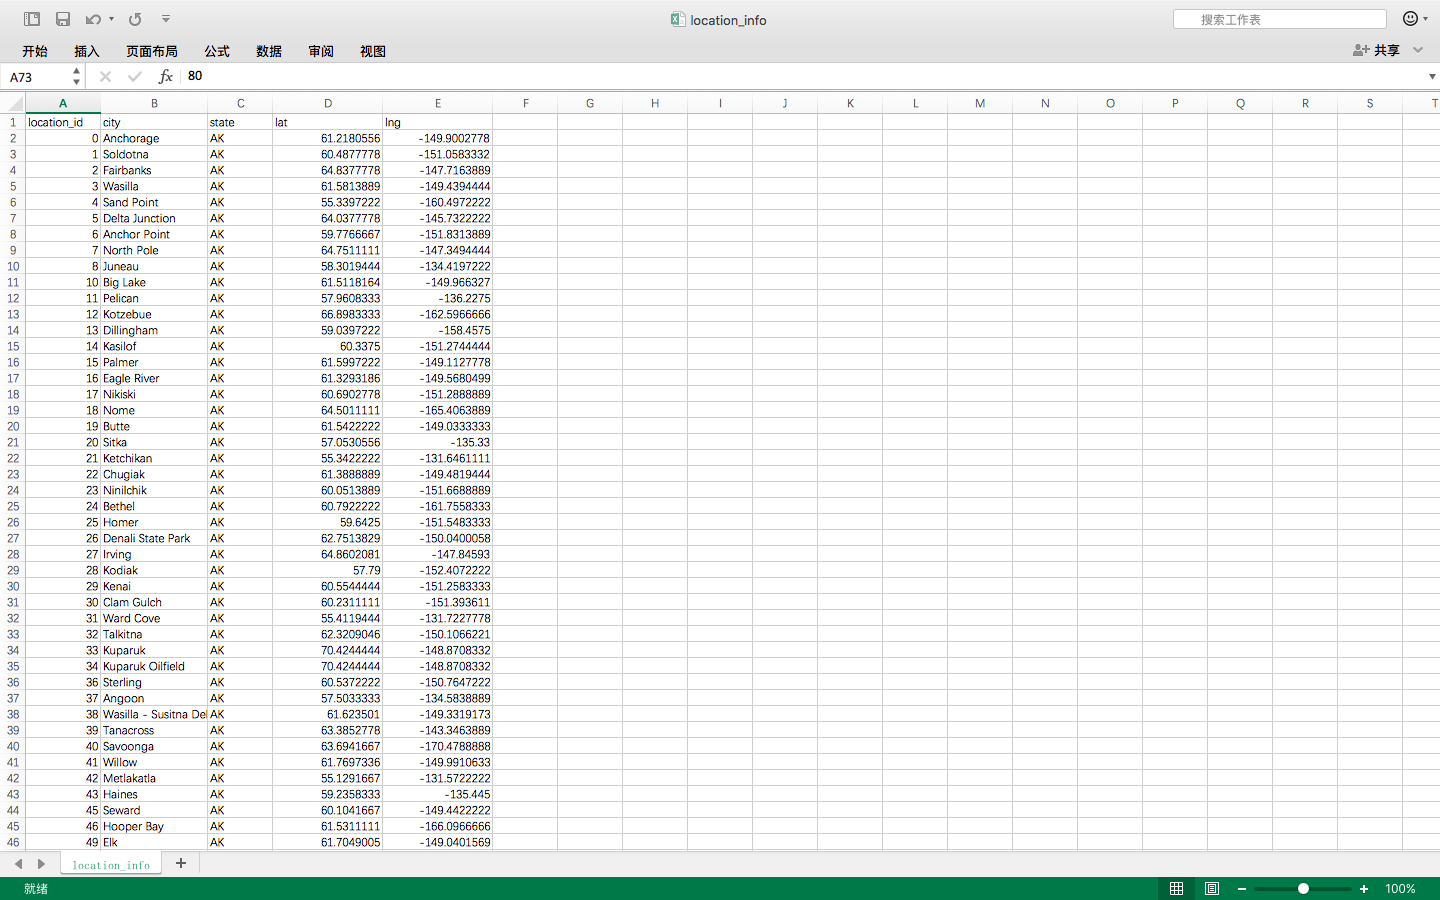
GIS data has five columns: location_id, city, state, lat and lng. Here's a glimpse of our GIS data stored as CSV file:
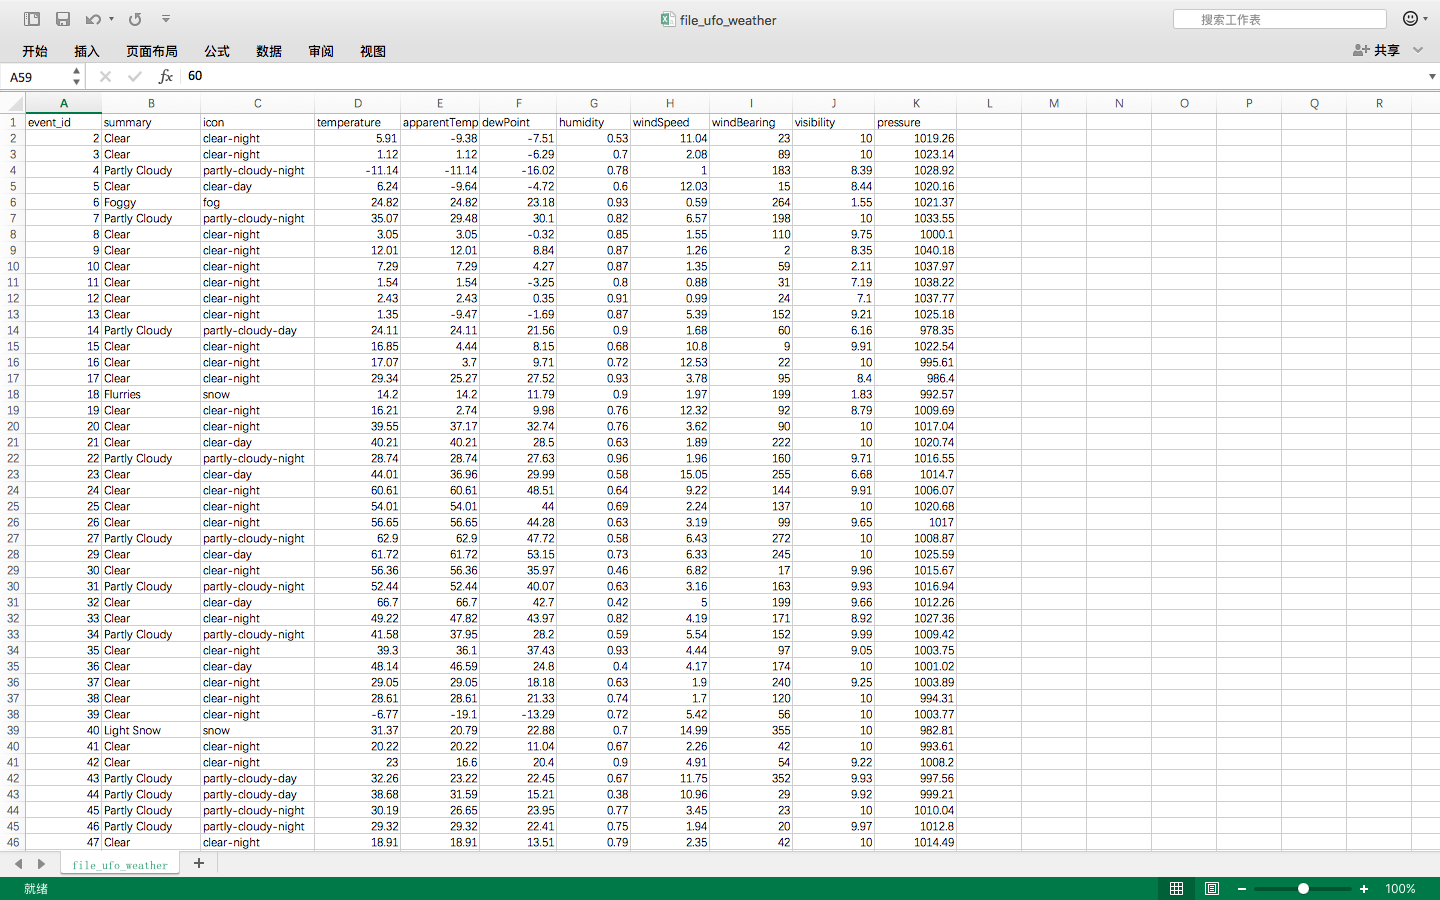
Weather data has eleven columns: event_id, summary, icon, temperature, apparentTemp, dewPoint, humidity, windSpeed, windBearing, visibility and pressure. Here's a glimpse of our weather data stored as CSV file:
For the convenience of data analyzing, we create a relational database "my_ufo.db" which has two tables "events" and "weathers". Here's the schema of the two tables:
          events(event_id:int, year:int, month:int, day:int, time:text, city:text, state:text, shape:text, duration:text, summary:text, lat:float, lng:float)

          weathers(event_id:int, summary:text, icon:text, temperature:float, apparentTemperature:float, dewPoint:float, humidity:float, windSpeed:float, windBearing:int, visibility:float, pressure:float)
We are investigating into the relationship of UFOs features or characteristics with corresponding weather or GIS information and probably predicting the occurrence of UFO at certain location and time. Thus we make use of Google heat map to show the distribution of UFO witnesses from 1950 to 2017, as shown below. From this figure, we can find out that in general, there are more sightings in the east part of US, while Los Angles, which is in the west coast, reports much more witnesses compared to regions around.
Here we do some basic statistic analysis about our UFO reports data.
The first thing we try to figure out is the distribution of UFO sighting in one day. The following histogram shows sighting distribution among 24 hours, based on whole database. It is obvious that most sightings are found at 21:00. And the events increase significantly after 18:00. Although it is more possible to see an UFO at night, there are not many sightings after 00:00. This is because many people are sleeping and we should eliminate this noice during further machine learning.
The following pie chart shows the shape of UFO sightings. UFOs with “light” shape are most in common. The next one is “circle” shape.
Our next step is to do dynamic analysis: the number of sightings in different years. Since our weather data is from 1950 to 2017, here we just analyze UFO reports during the same period. California and Texas seems to report more sightings compared to other regions, while Louisiana reports less than others. Another finding is that states around The Great Lakes have higher number and percentage to report. It seems UFO are more likely to appear around lakes, see and deserts. More analysis is needed. Here we also realize that higher population density may cause bigger number of reports. So further work should have an insight of it.
Discussion
- We think that data collecting and leaning is the hardest part we've encountered so far, because it's sometimes very difficult to find the data we need to further analyze.
- Our hypothesis is that the probability of UFO events' appearance is much higher where altitude is high and when humidity is high.
- We find that the west and east coast of United States are locations where UFO witnesses occurred the most. And maybe it has something to do with local geography and weather condition.
- Moving forward, we think the biggest problems are using machine-learning to train our data, figure out patterns and correlation between UFO witness with GIS and weather at that time.
- Given our initial exploration of the data, we think we are on track with our project and it's worth proceeding with our project.